Tracing My Agents with MLflow
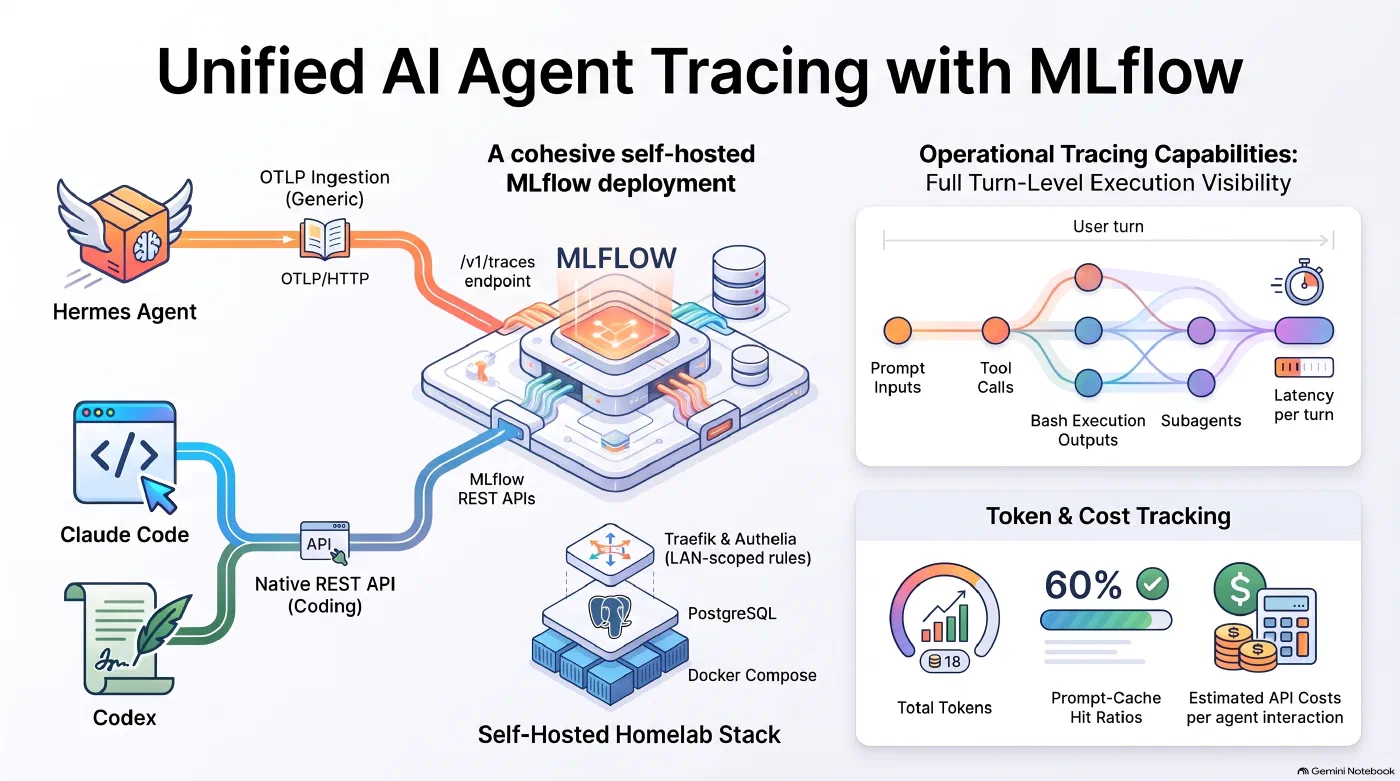
A Claude Code trace in MLflow with its tool calls and token usage - AI generated
Introduction
Over the last months, more of my work has moved to agents. Two questions keep coming back: how to set up agents in an enterprise environment, and how to work with them efficiently and securely. Hermes Agent runs in my homelab and takes care of research and routine tasks, while Claude Code and Codex write the code for small software projects. What I usually see of their work is the result. What happened in between, from the tool calls to the tokens each turn used, stays hidden in a terminal or a chat history.
In my last post , I also claimed that my new development workflow uses fewer tokens, and I admitted that I cannot prove it yet. Tracing is how I want to change that. In this post, I describe how I collect traces from my agents in a self-hosted MLflow instance in my homelab. I start with the deployment and then cover the configuration for Hermes Agent, Claude Code and Codex, as well as for model calls that go through LiteLLM.
What a Trace Shows
MLflow started as a platform for tracking machine learning experiments. Its tracing feature records what happens inside LLM applications and agents, and the documentation lists ready-made integrations for coding agents like Claude Code, Codex and Gemini CLI, as well as for Hermes Agent.
A trace covers one turn of an agent, from the request to the answer. The turn is the root span. Below it, every model call and every tool call gets its own span with its inputs and outputs, and the trace as a whole records the token usage. MLflow groups traces in experiments. I use three: one for Hermes Agent, one for coding agents, which Claude Code and Codex share, and one for LLM requests that go through LiteLLM.
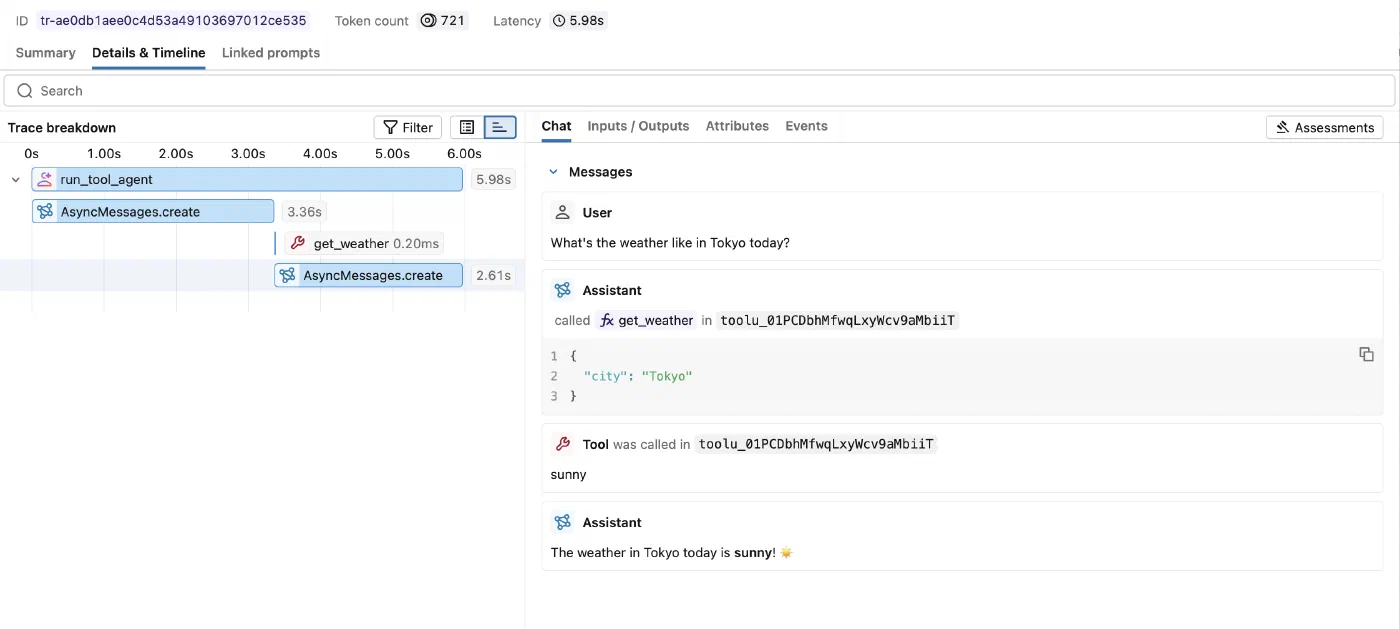
A trace in the MLflow UI with the agent span at the root, two model calls and a tool call below it, and the conversation on the right - Source
MLflow accepts traces on two paths. Integrations built for MLflow write through its REST API, which is what the Claude Code and Codex integrations do. Everything else can send OpenTelemetry data to the endpoint for the OpenTelemetry Protocol (OTLP) at /v1/traces, and that is the path Hermes Agent and LiteLLM take. The endpoint needs MLflow 3.6 or newer and a SQL database as backend store.
Deploying MLflow in the Homelab
MLflow runs on the setup I described in my homelab post : Docker Compose on a single host, with Traefik in front for TLS and host-based routing. As a starting point, I used the Docker Compose file from the MLflow repository on GitHub and adjusted it for my setup, so that Traefik works as the reverse proxy in front of MLflow.
Hermes Agent
Hermes Agent runs on a dedicated host in my homelab, as described in my post about it . It does not send traces on its own. The community plugin hermes-otel by Brian Caffey adds OpenTelemetry export to a long list of backends, MLflow among them. I run version 1.21.0. Installing the plugin does not activate it, so it takes two commands:
hermes plugins install hermes_otel
hermes plugins enable hermes_otel
Plugins in Hermes belong to a profile. If you run more than one profile, as I described in my post about bot mode , each profile needs the plugin and its configuration. Otherwise, only the profile you set it up for sends traces.
The plugin reads its settings from ~/.hermes/hermes_otel.yaml. The MLflow documentation places the file inside the plugin folder instead, but the file in the home directory takes precedence. Mine looks like this:
enabled: true
force_flush_on_session_end: true
capture_sender_id: true
capture_conversation_history: true
backends:
  - type: otlp
    name: mlflow
    endpoint: https://mlflow.home.example.com/v1/traces
    metrics: false
    logs: false
    headers:
      x-mlflow-experiment-id: "2"
The header routes the spans to the Hermes experiment, which has the ID 2 in my instance. Metrics and logs are switched off, so MLflow only receives traces, and force_flush_on_session_end exports any buffered spans when a session ends. The plugin registers 15 hooks in Hermes, covering agent turns, model and API calls, tool calls, skills, approvals, subagents and cron jobs. Each turn becomes a trace with an agent span at the root and child spans for model calls (llm.<model>, api.<model>), tools (tool.<name>), skills and subagents.
Claude Code
For Claude Code, MLflow maintains its own plugin. It writes traces through the REST API and needs no local Python installation. The marketplace has to be added in the terminal, because the command inside Claude Code clones the whole MLflow repository and tends to time out:
claude plugin marketplace add mlflow/mlflow --sparse .claude-plugin
claude plugin install mlflow-tracing@mlflow-plugins
After a restart of Claude Code, /mlflow-tracing:setup asks for the tracking URI, the experiment and the scope, and /mlflow-tracing:status shows the result. With user scope, tracing covers every project. My ~/.claude/settings.json holds three environment variables for it:
"env": {
  "MLFLOW_CLAUDE_TRACING_ENABLED": "true",
  "MLFLOW_TRACKING_URI": "https://mlflow.home.example.com",
  "MLFLOW_EXPERIMENT_ID": "3"
}
Setting MLFLOW_CLAUDE_TRACING_ENABLED=false switches tracing off for sessions started from that shell. Instead of the plugin, mlflow autolog claude from the MLflow Python package, version 3.4 or newer, can write the hooks into the .claude/settings.json of a single project.
A Claude Code trace contains the prompts and responses, every tool call with its inputs and outputs, and the use of subagents and skills. Tool outputs include file contents and command output, so a trace holds everything the agent read. Each trace also records the token usage, including the tokens served from the prompt cache, and a cost estimate. The cost is calculated from API prices, so on a subscription plan it is a reference value for what the same tokens would cost through the API. The documentation says that traces appear when a session ends. In my setup, a trace arrives after every turn, and the traces of one session share a session ID.
Codex
MLflow’s Codex integration uses Codex’s notify hook, which Codex calls after every turn. The npm package @mlflow/codex provides the hook and a setup command:
npm install -g @mlflow/codex
mlflow-codex setup
The setup asks for the scope, project or user, and then for the tracking URI and the experiment ID. It writes notify = ["mlflow-codex", "notify-hook"] into Codex’s config.toml and stores the MLflow settings in a mlflow-tracing.json file next to it. My Codex traces go to the same experiment as the ones from Claude Code:
{
  "trackingUri": "https://mlflow.home.example.com",
  "experimentId": "3"
}
A Codex trace has an agent span at the root with model and tool calls below it. It records the token usage and, inside a Git repository, the repository, branch and commit. Codex can also export its own OpenTelemetry traces to /v1/traces. According to the MLflow documentation, those show internal details like websocket connections and tool scheduling, and the hook is the better source for the conversation itself. I have not enabled the OTLP export.
LiteLLM
LiteLLM is a proxy that offers one OpenAI-compatible API in front of many model providers. In my homelab, I use it as the model gateway and as the registry for Model Context Protocol servers in my Open WebUI setup, which I described in my post about my local AI stack . Every request that goes through it can be traced as well.
I use LiteLLM’s built-in OpenTelemetry callback, which sends the spans to the same OTLP endpoint as Hermes Agent. It takes one setting in the LiteLLM config.yaml:
litellm_settings:
  callbacks: ["otel"]
The exporter reads its target from four environment variables in the compose file:
environment:
  OTEL_EXPORTER: otlp_http
  OTEL_ENDPOINT: http://mlflow:5000/v1/traces
  OTEL_HEADERS: x-mlflow-experiment-id=${MLFLOW_LITELLM_EXPERIMENT_ID}
  OTEL_SERVICE_NAME: litellm
The endpoint uses the container name instead of the public host name. LiteLLM and MLflow share a Docker network, so the spans never pass through Traefik.
Conclusion
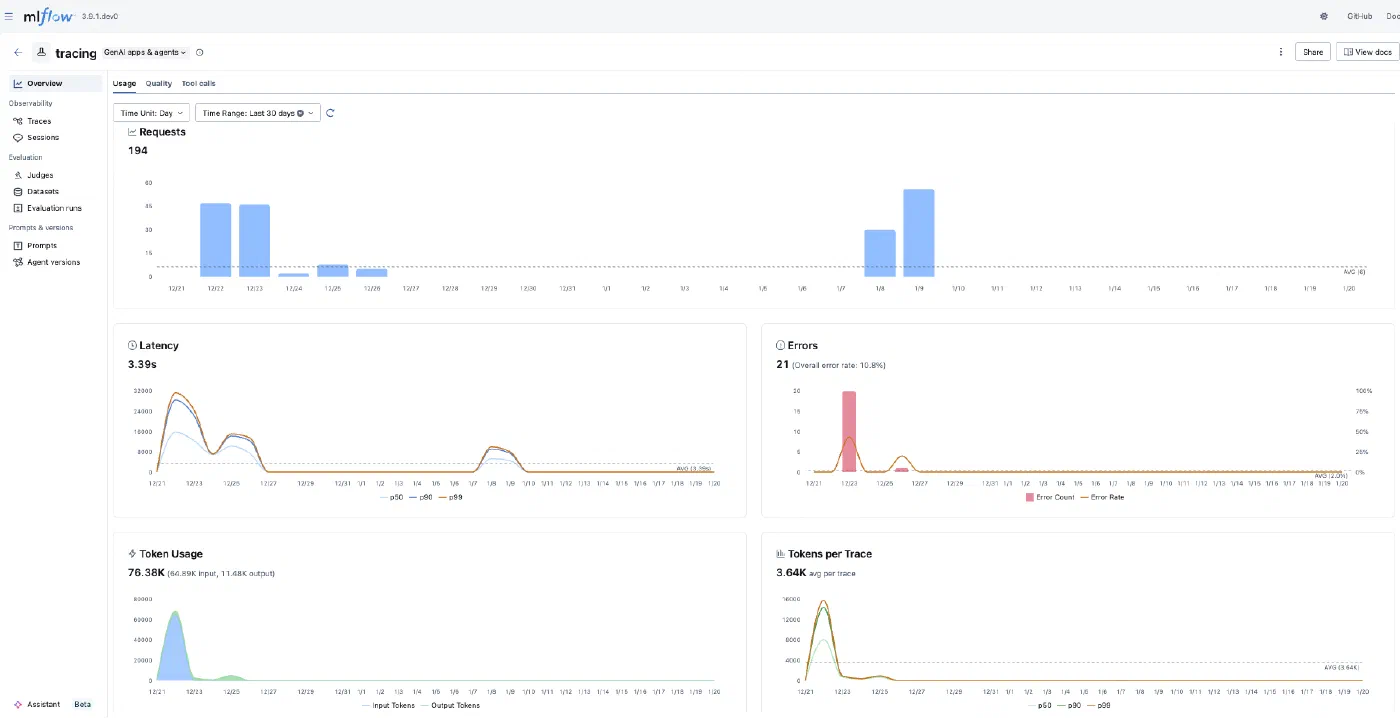
The overview page of an MLflow experiment aggregates requests, latency, errors and token usage across all traces - Source
One MLflow instance in my homelab now collects traces from various sources. Hermes Agent and LiteLLM send OpenTelemetry spans, while Claude Code and Codex use integrations that MLflow maintains itself. LiteLLM covers every model request from Open WebUI, and its spans land in Postgres. The setup took an evening. The more interesting work starts now, with the questions the traces can answer, from the tokens a single task costs to the price of a Hermes routine.
References
- MLflow - link
- MLflow Docker Compose file on GitHub - link
- MLflow: OpenTelemetry trace ingestion - link
- MLflow Tracing: Hermes Agent - link
- MLflow Tracing: Claude Code - link
- MLflow Tracing: Codex CLI - link
- MLflow Tracing: LiteLLM - link
- hermes-otel on GitHub - link
- LiteLLM: OpenTelemetry integration - link
- My Traefik-centered homelab setup - link
- My Local AI Stack: Open WebUI, LiteLLM, SearXNG, and Docling - link
- Hermes Agent: A Personal AI That Gets More Useful Over Time - link
- Hermes Bot Mode: Persistent Specialist Profiles - link
- From Vibe Coding to Spec-Driven Development - link
Author: Dr. Stephan Michard
Words: 1489